Histogram
Overview
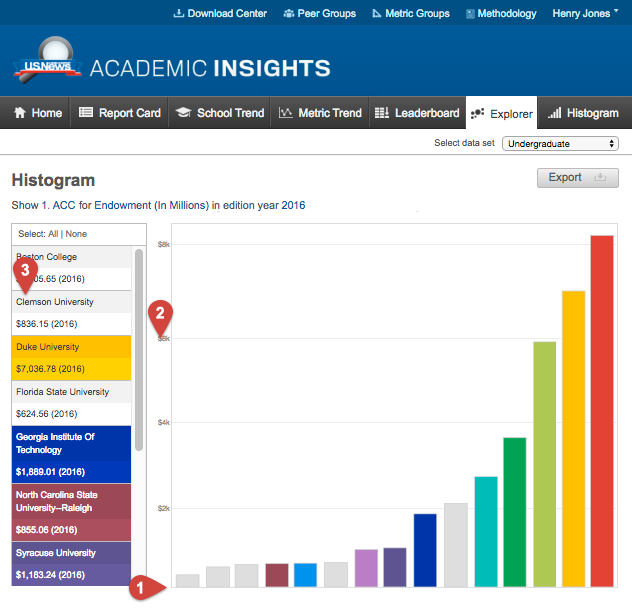
The Histogram View displays the distribution of values for a certain metric for the selected Peer Group. Each bar in the graph represents a school’s value.
Using this View

- The x axis shows all of the schools in the selected Peer Group.
- The y axis is the metric value.
- Click a school name in this table and the corresponding bar will be highlighted in the same color. Alternatively, you can select a bar on the graph and the school name in the table will be highlighted in the same color.