Report Card
Overview
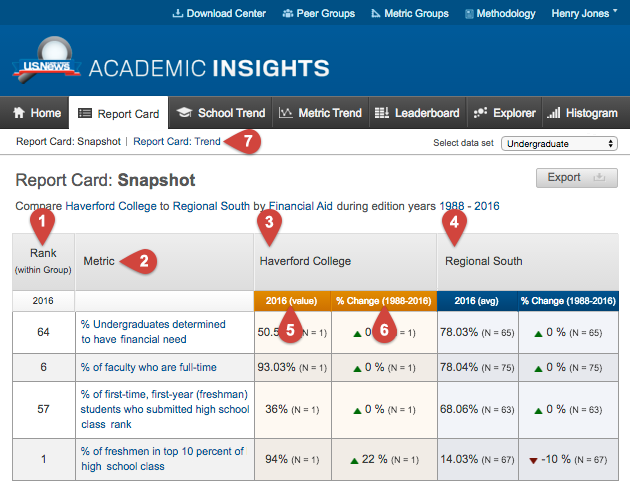
This view allows for a static look at the data for the most recent date you choose and a percent change across the timeline selected. It is best used as a starting point for analysis. The rank within the selected group is also displayed. The metric values displayed for the Peer Group reflect the average of the group.
Report Card - Snapshot

- Rank within the selected group for the most recent selected year.
- Metric name.
- Data for the first selected school or Peer Group.
- Data for the second selected school or Peer Group.
- Metric value for the most recent selected year.
- Percent change for the selected time frame.
- Toggle to see the Report Card - Trend View.
Report Card - Trend View
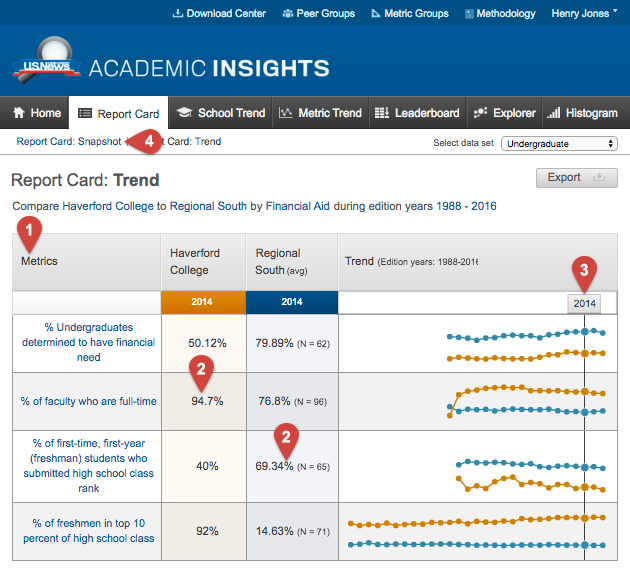
This view allows you to trend your school’s data over time against the Peer Group average to highlight trends for further investigation. As you move the vertical bar across the trended line, the values displayed reflect the selected year.

- Metric name.
- Metric value for selected year.
- Drag to view and compare values for each year.
- Toggle to see the Report Card - Snapshot.